Usage
Retrieve the World overview
import covid_daily

overview = covid_daily.overview(as_json=False)

print(overview.head())
As already mentioned, this function retrieves an overview of the COVID-19 from all the available countries as indexed in Worldometers.info/coronavirus
    Country,Other TotalCases NewCases TotalDeaths NewDeaths  ... Serious,Critical TotCases/1M pop Deaths/1M pop TotalTests Tests/1M pop
0           World  4,125,046  +26,758     280,957      +733  ...           47,637             529          36.0        NaN          NaN
1             USA  1,347,325      +16      80,041        +4  ...           16,816           4,070           242  8,918,345       26,943
2           Spain    264,663   +1,880      26,621      +143  ...            1,741           5,661           569  2,467,761       52,781
3           Italy    218,268      NaN      30,395       NaN  ...            1,034           3,610           503  2,514,234       41,584
4              UK    215,260      NaN      31,587       NaN  ...            1,559           3,171           465  1,728,443       25,461
Retrieve chart’s data from every country
import covid_daily

data = covid_daily.data(country='spain', chart='total-currently-infected-linear', as_json=False)

print(data.head())
Which returns a pandas.DataFrame containing all the information provided by Worldometers related to the total amoun of infected people because of the COVID-19 in Spain, in this case.
            Currently Infected
Date
2020-05-09               63148
2020-05-10               61603
2020-05-11               63553
2020-05-12               62130
2020-05-13               60764
Note that this functions lets the user change the country and the chart type from which data will be retrieved, containing different statistics. All the available countries can be found at AVAILABLE_COUNTRIES and all the available chart types at AVAILABLE_CHARTS.
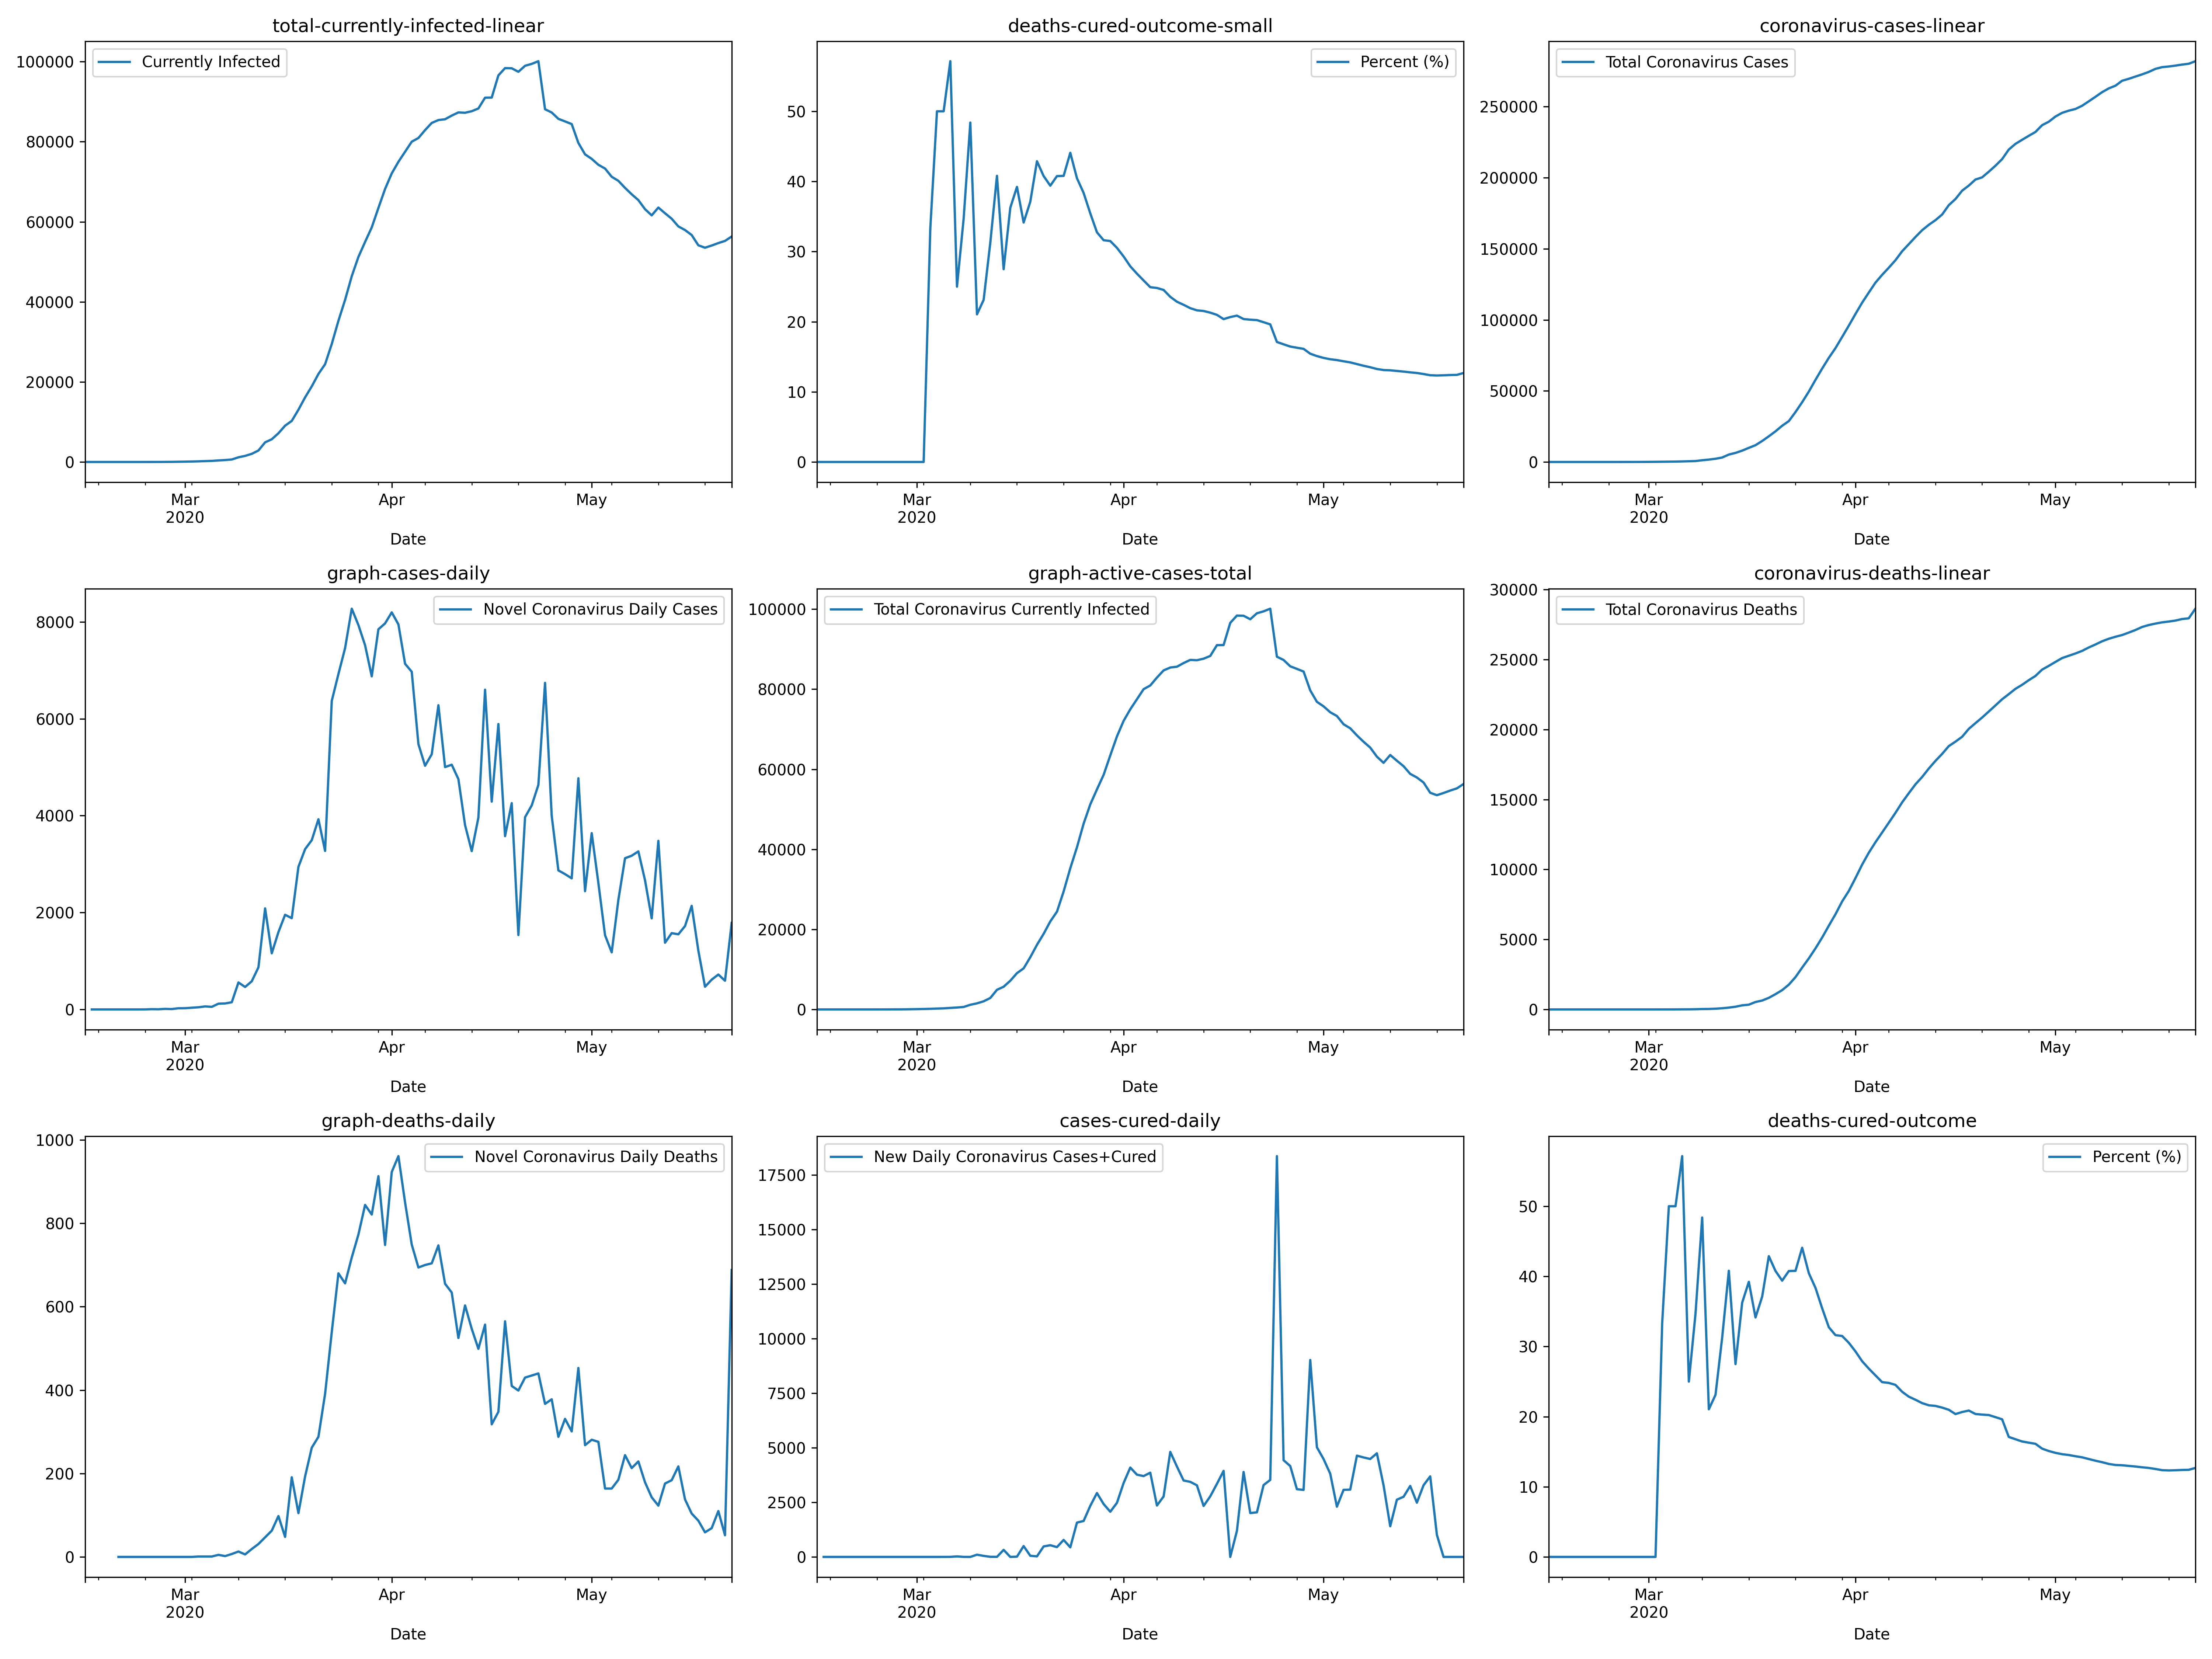
Retrieve & Plot all the available charts
import covid_daily
from covid_daily.constants import AVAILABLE_CHARTS

import matplotplib.pyplot as plt

fig, axs = plt.subplots(3, 3, figsize=(20,15))

from itertools import product

pairs = list(product((range(3)), (range(3))))

for idx, available_chart in enumerate(AVAILABLE_CHARTS):
    data = covid_daily.data(country='spain', chart=available_chart, as_json=False)
    data.plot(ax=axs[pairs[idx]], title=available_chart)

fig.tight_layout()
fig.show()
The resulting figure containing all the data (charts) from Spain, as previously retrieved, is shown below, generated after the previous code block.