Welcome to covid_daily’s documentation!
Introduction
Coronavirus (COVID-19) Daily Data from Worldometers with Python
Installation
In order to get this package working you will need to install it via pip (with a Python3.5 version or higher) on the terminal by typing:
$ pip install covid_daily
Documentation
You can find the complete developer documentation at: https://covid_daily.readthedocs.io/, hosted on Read the Docs and generated using sphinx with the theme sphinx_rtd_theme which is the standard Read the Docs theme for sphinx.
Usage
Retrieve the World overview
import covid_daily
overview = covid_daily.overview(as_json=False)
print(overview.head())
As already mentioned, this function retrieves an overview of the COVID-19 from all the available countries as indexed in Worldometers.info/coronavirus
Country,Other TotalCases NewCases TotalDeaths NewDeaths ... Serious,Critical TotCases/1M pop Deaths/1M pop TotalTests Tests/1M pop
0 World 4,125,046 +26,758 280,957 +733 ... 47,637 529 36.0 NaN NaN
1 USA 1,347,325 +16 80,041 +4 ... 16,816 4,070 242 8,918,345 26,943
2 Spain 264,663 +1,880 26,621 +143 ... 1,741 5,661 569 2,467,761 52,781
3 Italy 218,268 NaN 30,395 NaN ... 1,034 3,610 503 2,514,234 41,584
4 UK 215,260 NaN 31,587 NaN ... 1,559 3,171 465 1,728,443 25,461
Retrieve chart’s data from every country
import covid_daily
data = covid_daily.data(country='spain', chart='total-currently-infected-linear', as_json=False)
print(data.head())
Which returns a pandas.DataFrame containing all the information provided by Worldometers related to the total amoun of infected people because of the COVID-19 in Spain, in this case.
Currently Infected
Date
2020-05-09 63148
2020-05-10 61603
2020-05-11 63553
2020-05-12 62130
2020-05-13 60764
Note that this functions lets the user change the country and the chart type from which data will be retrieved, containing different statistics. All the available countries can be found at AVAILABLE_COUNTRIES and all the available chart types at AVAILABLE_CHARTS.
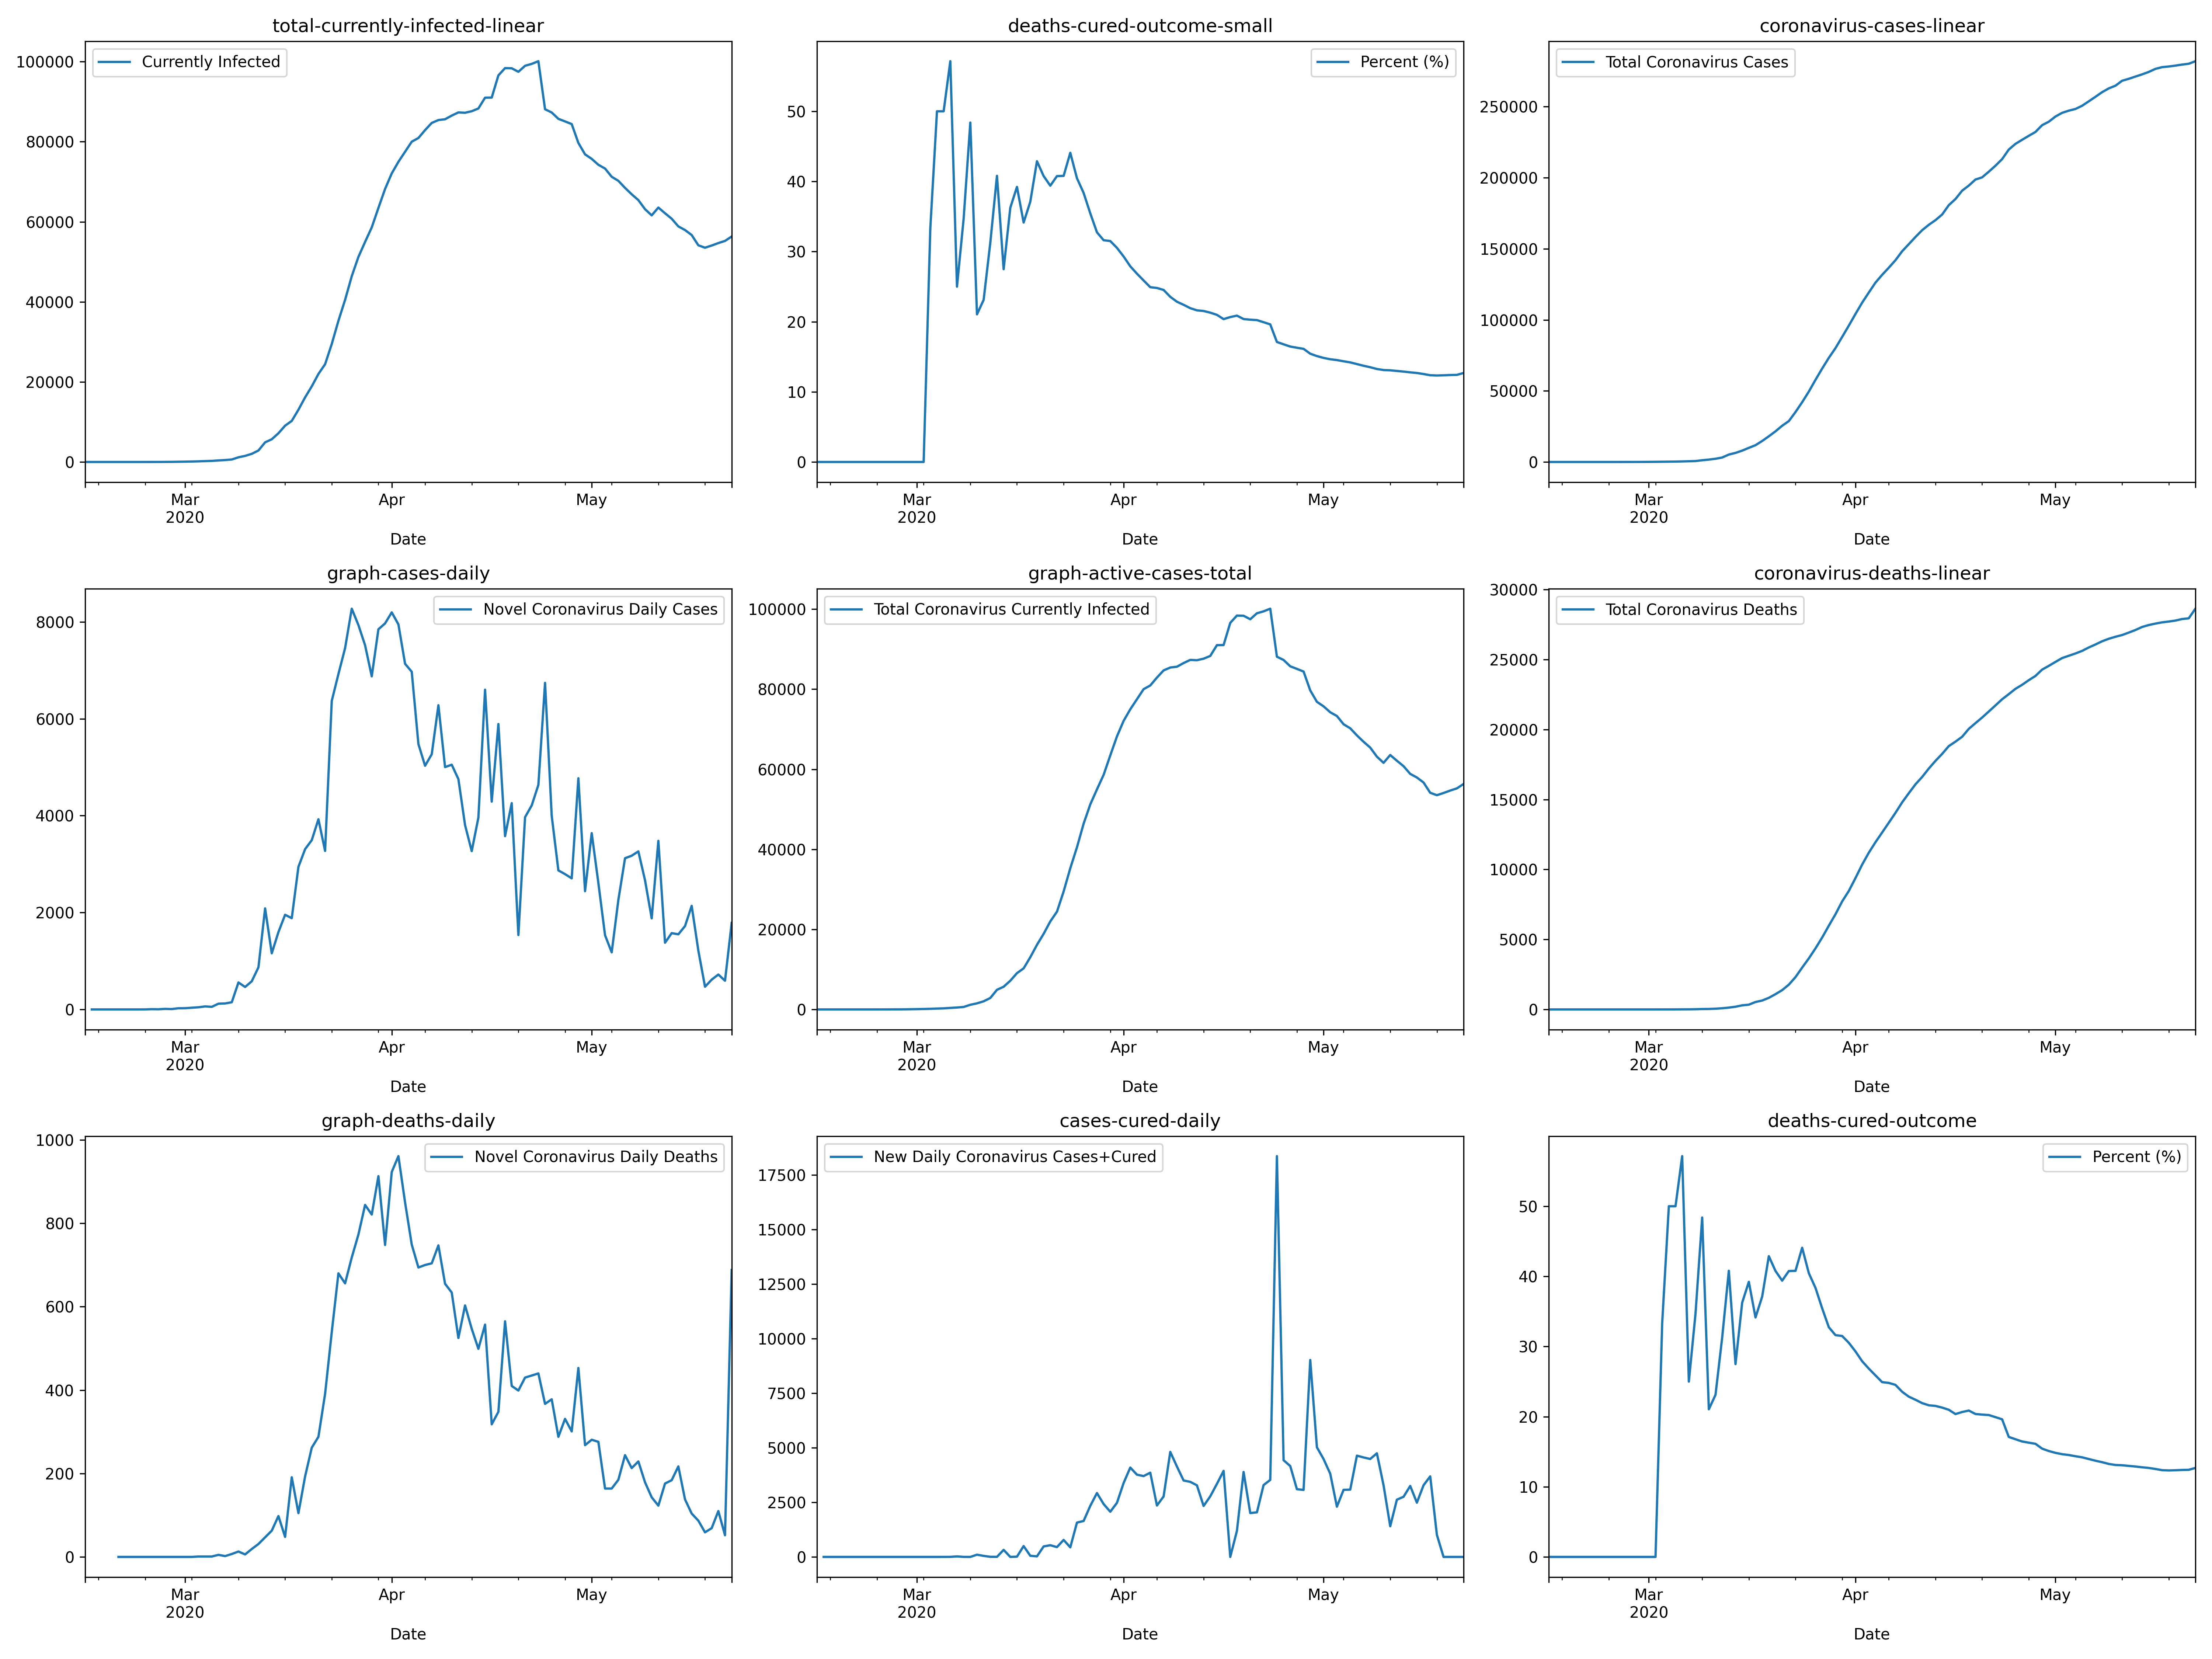
Retrieve & Plot all the available charts
import covid_daily
from covid_daily.constants import AVAILABLE_CHARTS
import matplotplib.pyplot as plt
fig, axs = plt.subplots(3, 3, figsize=(20,15))
from itertools import product
pairs = list(product((range(3)), (range(3))))
for idx, available_chart in enumerate(AVAILABLE_CHARTS):
data = covid_daily.data(country='spain', chart=available_chart, as_json=False)
data.plot(ax=axs[pairs[idx]], title=available_chart)
fig.tight_layout()
fig.show()
The resulting figure containing all the data (charts) from Spain, as previously retrieved, is shown below, generated after the previous code block.
API Reference
covid_daily.covid
-
covid_daily.covid.data(country, chart, as_json=False)¶ This function will retrieve the coronavirus data overview from all the available countries from worldometers.info/coronavirus/, which contains real time data and statistics from multiple features realted to the virus. For more information, please visit: https://www.worldometers.info/coronavirus/
Parameters: - chart (
str) – name of the country to retrieve the COVID data from (available values at: covid_daily.constants.AVAILABLE_COUNTRIES) - chart – name of the chart to retrieve the COVID data from (available values at: covid_daily.constants.AVAILABLE_CHARTS)
- as_json (
bool) – set to True if overview wants to be retrieved asjson, if not, leave default value (False).
Returns: pandas.DataFrame- dataThis function returns a
pandas.DataFrameby default (if as_json parameter is set to False, if True ajsonis returned), containing the COVID data of the introduced chart from the introduced country.
Raises: ValueError– raised if any of the introduced parameters is not validConnectionError– raised if connection with Worldometers failed
- chart (
-
covid_daily.covid.overview(as_json=False)¶ This function retrieves the coronavirus data overview from all the available countries from worldometers.info/coronavirus/, which contains real time data and statistics from multiple features realted to the virus. For more information, please visit: https://www.worldometers.info/coronavirus/
Parameters: as_json (
bool) – set to True if overview wants to be retrieved asjson, if not, leave default value (False).Returns: pandas.DataFrame- overviewThis function returns a
pandas.DataFrameby default (if as_json parameter is set to False, if True ajsonis returned), containing the world overview coronavirus data.
Raises: ValueError– raised if any of the introduced parameters is not validConnectionError– raised if connection with Worldometers failed
Contribute
As this is an open source project it is open to contributions, bug reports, bug fixes, documentation improvements, enhancements and ideas. There is an open tab of issues where anyone can open new issues if needed or navigate through them in order to solve them or contribute to its solving. Remember that issues are not threads to describe multiple problems, this does not mean that issues can’t be discussed, but so to keep a structured project management, the same issue should not describe different problems, just the main one and some nested/related errors that may be found.
Citation
When citing this repository on your publications please use the following BibTeX citation:
@misc{
covid_daily,
author = { Alvaro Bartolome del Canto },
title = { covid_daily - Coronavirus (COVID-19) Daily Data from Worldometers with Python },
year = { 2020 },
publisher = {GitHub},
journal = {GitHub Repository},
howpublished = {\url{https://github.com/alvarobartt/covid-daily}}
}
Credits
This repository has been generated using pypackage-cookie